AvalonBay Communities (NYSE:AVB) is shifting toward more suburban and sunbelt areas. Overall, AVB’s performance for the quarter looks positive.
AvalonBay Communities
Projected growth in FFO per share was 1.4%. That may be revised up slightly based on more recent commentary. Revenue growth is coming in slightly higher than projected due to better occupancy and smaller losses on uncollectible lease revenue (deadbeats). Better occupancy encouraged AVB to seek higher leasing spreads. AVB indicated they plan to push out renewal offers at an average 5% increase for March and April 2024. Keep in mind that there’s quite a bit of turnover and new leases come in at lower spreads. So actual rental rates would increase materially less than 5%. Expect it to be low single digits after factoring in new leases.
Changing Regions
AVB has been a “gateway apartment REIT” for a long time. That means they were primarily in the “Gateway” markets. These are markets characterized by high rent and barriers to new supply. They are cities almost every American knows about, even if half of them can’t locate them on a map. Six examples: Los Angeles, San Francisco, Seattle, New York, Boston, and Washington, D.C.
As you might recall, those big cities performed vastly worse during the pandemic. Many REITs realized they wanted to also invest in other markets and development within the “Sunbelt” regions boomed.
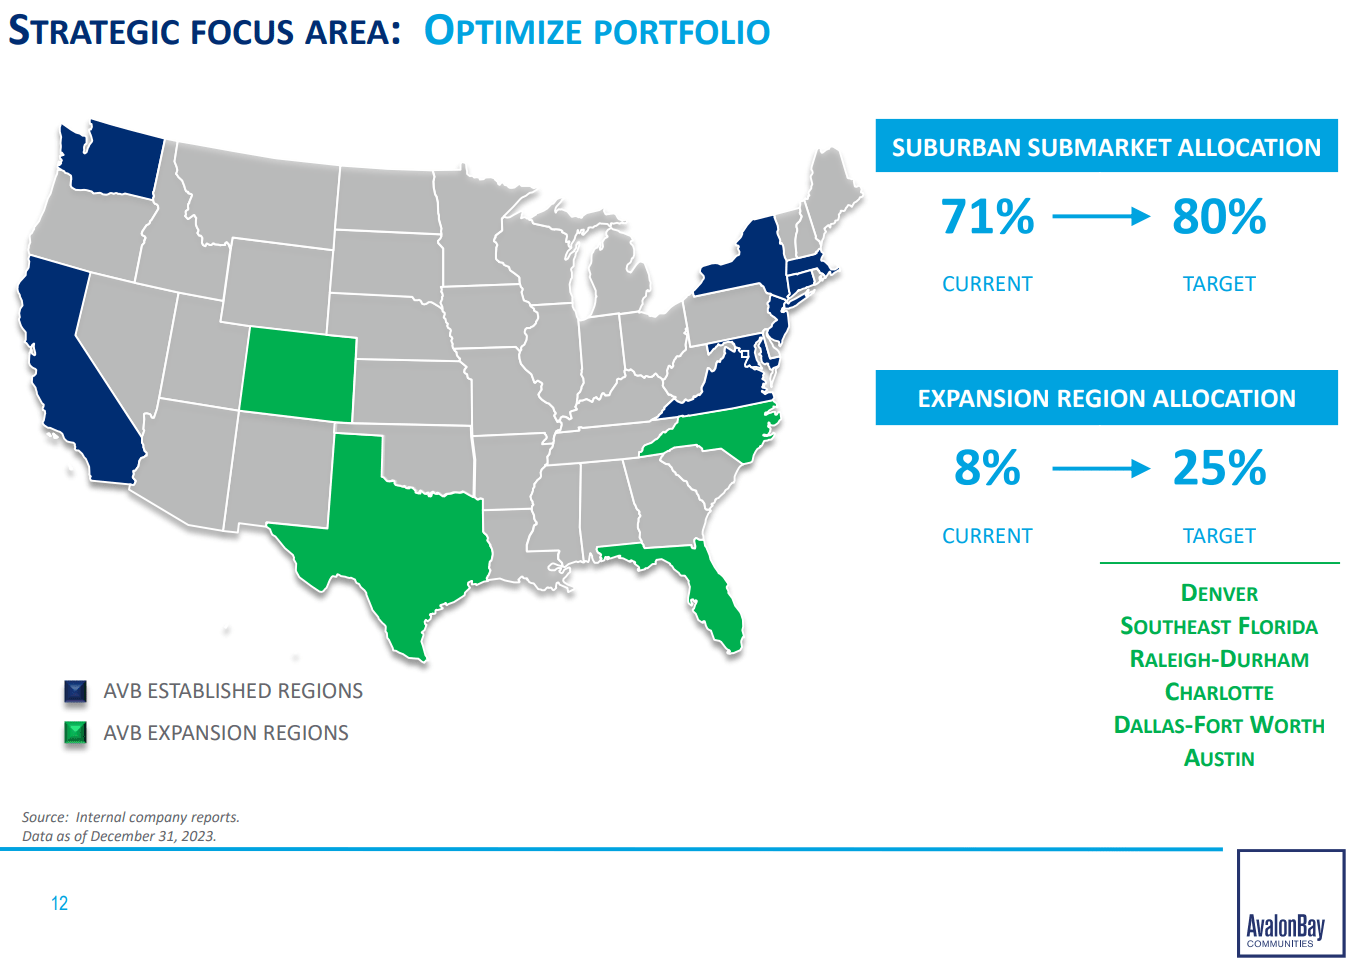
AVB had two goals for modifying their portfolio:
-
More suburban areas (further out from the city)
-
More sunbelt

AVB
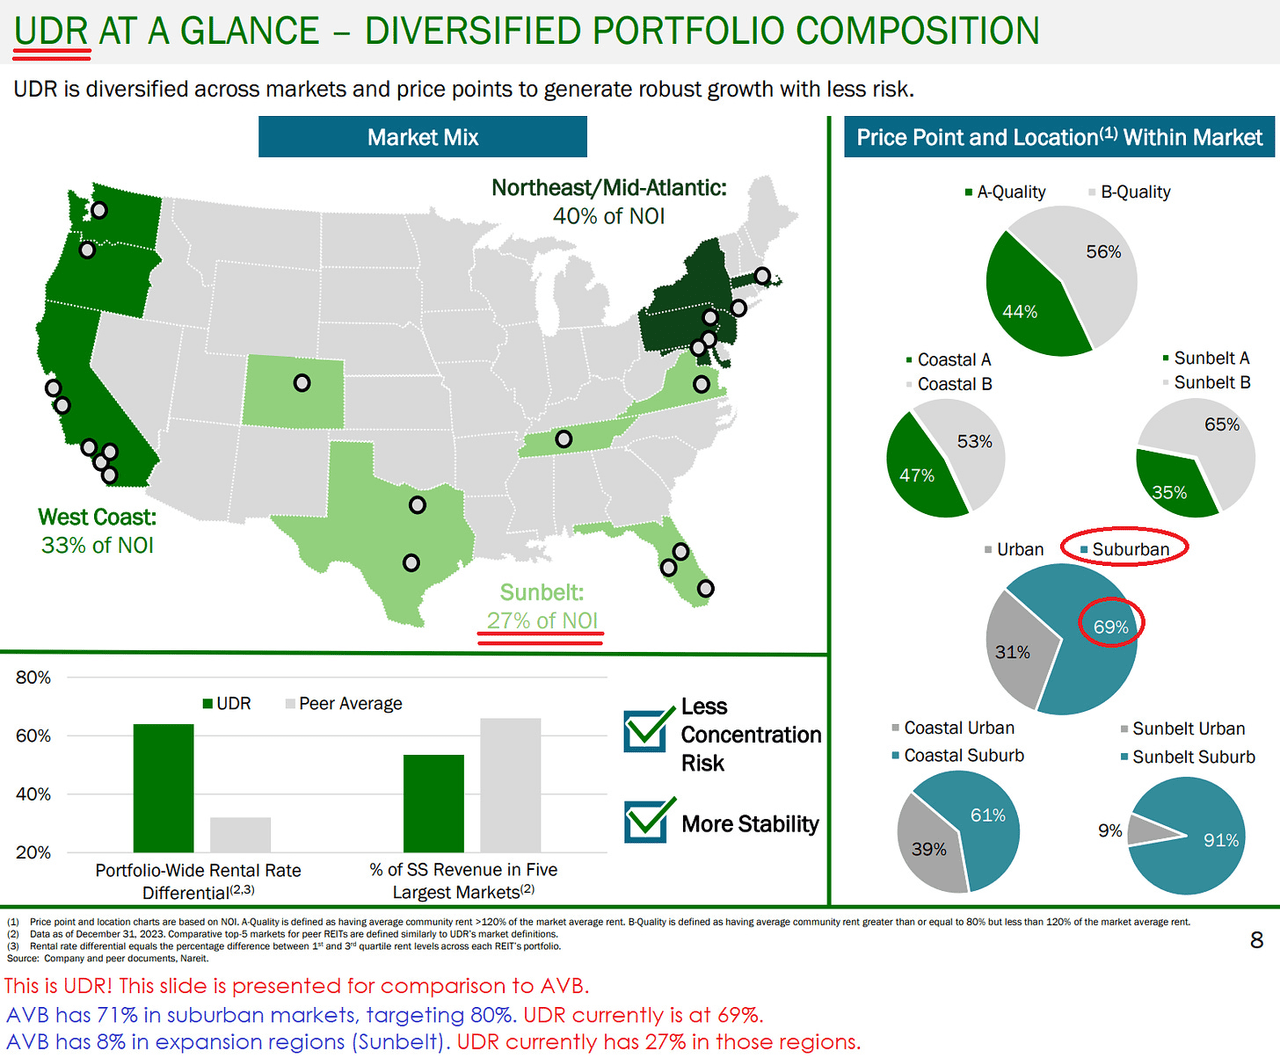
Those shifts are pretty big. To move from 71% to 80% suburban, they will need to sell some locations. Building more suburban locations will help, but getting the percentage that high will need to involve some sales.
The increased focus on the expansion regions could be handled with development.
I wanted to toss in a quick comparison to UDR because I think the shift toward sunbelt markets is interesting.

UDR
Which Regions Are Performing Better Today?
After the Sunbelt dominated for the last few years, the volume of new supply is creating a major headwind. That’s why Camden Property Trust and Mid-America Apartments have been weaker.
We predicted this boom years ago, though the impact on share prices took longer to play out than expected.
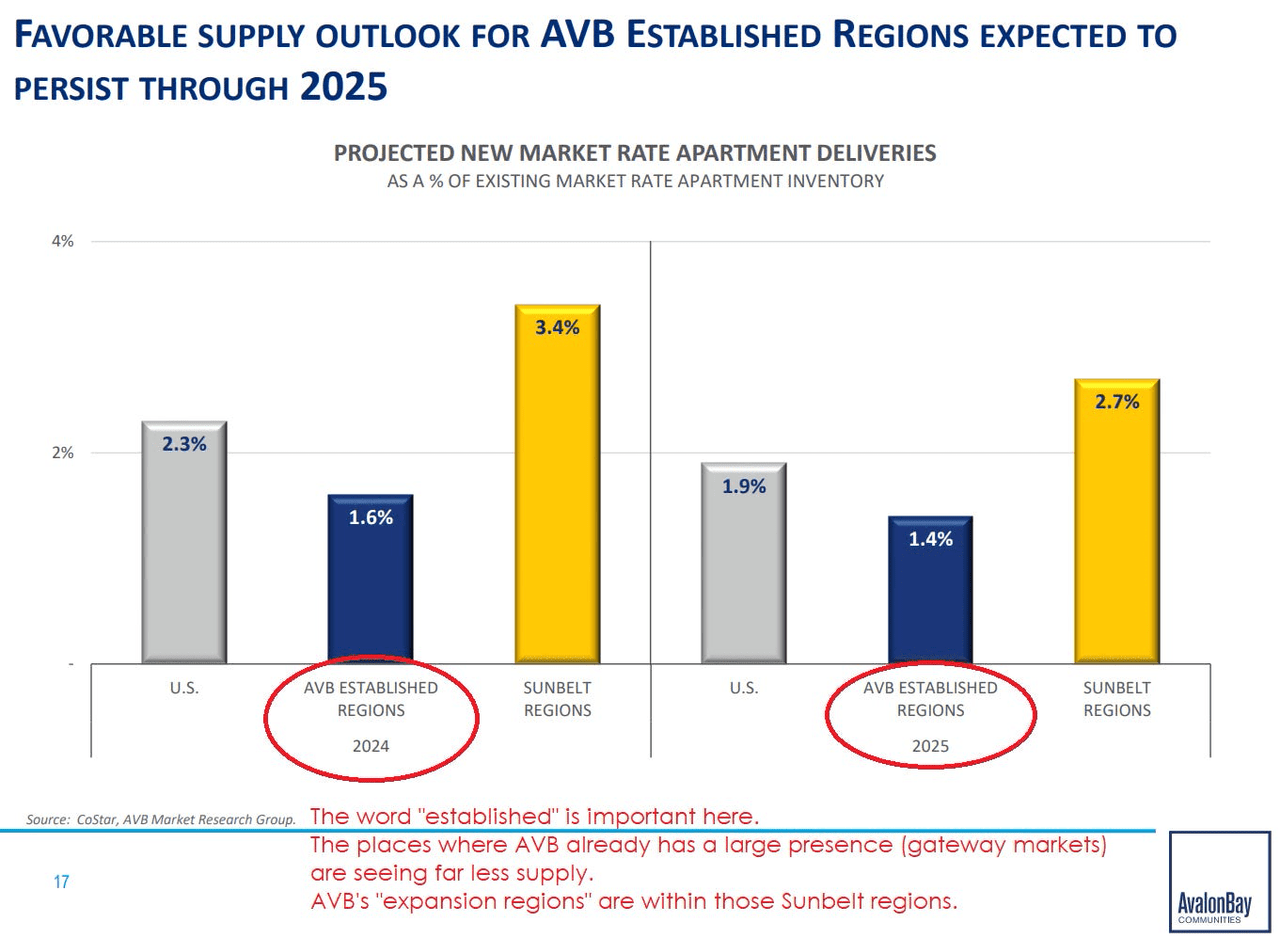
This chart really emphasizes the differences in the amount of development activity by area:

AVB
Because major players like AVB decided to go develop assets in the Sunbelt region, we’re seeing a boom in supply for those regions. Meanwhile, developers were not focused on the gateway markets, which are AVB’s established regions.
Management’s Guidance
-
Guidance for Core FFO per share growth: 1.4%
-
Guidance for SS NOI (Same Store Net Operating Income) growth: 1.25%
Overall Impression
I’m inclined to say my view on earnings and guidance was positive. AVB’s guidance is better than average for the sector. They also performed quite well on FFO per share over the last two years. However, there was nothing really shocking here. No big surprises to drive shares higher.
Relative Performance Chart Preview
I built some new charts a few months ago for demonstrating the change in key metrics over time.
After building those charts, I decided (as usual) that they were not quite meeting my goals.
Therefore, I designed a new layout that I think does a better job of capturing relative performance.
Rather than a chart, this time it is presented as a spreadsheet.
We’re showing the Core FFO per share growth for each year.
Each year has five values:
-
The first four values represent the annual guidance at the start of each quarter:
-
The final value represents the annual result.

The REIT Forum
The sheet is color-coded on a relative basis. Green is strong. Red is weak.
I’ve included multiple periods because it creates a much better feeling for the year-over-year trends throughout the sector.
You can see how Core FFO per share growth:
-
Was extremely strong in 2022
-
Fell substantially in 2023 and
-
Declined further in 2024 (projected).
The decline is due to a combination of weaker same property NOI growth and higher interest rates.
Read the full article here


