ETF Profile
Investors looking for cost-efficient exposure to a diversified pool of European securities may consider looking at the Vanguard FTSE Europe ETF (NYSEARCA:VGK). VGK is something of a tried-and-tested product, having been around for close to two decades now, and during this time, it has also managed to accumulate the most AUM amongst all its peers, at nearly $20bn.
Currently, VGK covers over 1300 stocks from 16 different European markets, and it does so at an extremely compelling expense ratio of just 0.09% (for context, the average expense ratio for similar products works out to around 0.97%- Source: Morningstar). It’s not just that; there’s also a degree of consistency with the portfolio holdings, as exemplified by an inordinately low portfolio turnover rate (annual) of just 4%. Typically, most other ETFs see annual turnover rates that are close to 6x VGK’s figure.
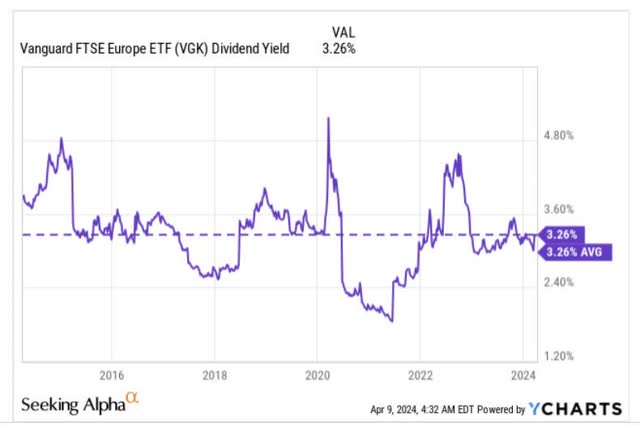
Investors looking for some income won’t be too disappointed as VGK has been paying quarterly dividends since 2012 (prior to that distributions used to take place annually), and at current prices, you can lock in a healthy yield of over 3.25%, which is interestingly, bang in line with the ETF’s 10-year average figure.
YCharts
Macro Commentary
If you’re looking for growth, Europe and VGK aren’t the best candidates. The IMF’s quarterly report, encompassing GDP growth forecasts for different regions across the world, already pointed to an unappealing real GDP growth outlook of just 0.9% for Europe this year. That number already marks the region as the slowest growing terrain (for context, the globe is poised to grow at 3.1% this year), but those expectations will likely be dialed down even further when the IMF comes out with its latest forecast next week. Note that the ECB, which was previously expecting 0.8% growth for FY24 in December, recently compressed its expectations for the year to 0.6%.
Now VGK’s major geographical exposure is the UK which accounts for close to one-fourth of the total holdings, and here too conditions are hardly different with expected GDP growth of 0.8%.
These underwhelming growth projections should also increase the prospect of rate cuts soon enough. Wage pressures appear to be abating, and in the UK growth of starting salaries for permanent staff has now dropped to their lowest level in three years, providing support that inflation could be heading closer to the 2% target, which it is likely to hit in the summer.
As far as the ECB is concerned, there are unlikely to be any massive changes in rate expectations during its policy meeting this week even if inflation appears to be dropping closer to target, but in June, prospects of a 25bps cut look increasingly likely. Conversely, in the US, the rate pivot prospects are becoming less obvious, with last week’s nonfarm payroll readings reiterating the strength in the labor market. It was initially expected that the US Fed would pivot before the ECB, but those expectations have now faded. If the ECB starts cutting rates before the US Fed, that isn’t going to reflect well on the Euro.
This shift to a rate-cutting stance is also going to reflect rather poorly on the net interest income (NII) trajectory of European banks who have already enjoyed their time in the sun, with the STOXX Europe 600 banks index hitting its highest point in close to six years. (note that the top sector exposure of VGK is towards the financial sector). After delivering 23% NII growth last year, this year’s NII growth is expected to be flat, followed by a -3% decline in FY25.
Valuation and Technical Commentary
From a valuation angle, VGK looks like quite a compelling bet. Morningstar data shows that the ETF can be picked up at a P/E of less than 13x, which makes it one of the cheaper environments in the world. For perspective, a portfolio that covers global stocks – the Vanguard Total World Stock Index Fund ETF Shares (VT) is priced at a premium of roughly 33%.
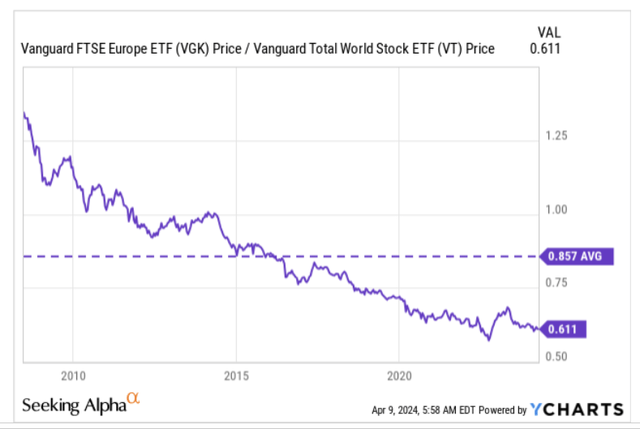
Graphically, it also looks like European stocks look like one of the most beaten-down terrains around the globe, and offer good promise as mean-reversion candidates. Currently, VGK’s relative strength ratio versus VT translates to a 29% discount versus its long-term average.
YCharts
However, investors should take note of the anemic growth prospects and sub-par earnings growth of this region. Morningstar data suggests that VGK’s 1,300-odd stocks will likely only deliver long-term earnings of less than 8%. In contrast, global stocks could see a better threshold of double-digit earnings growth.
Investing
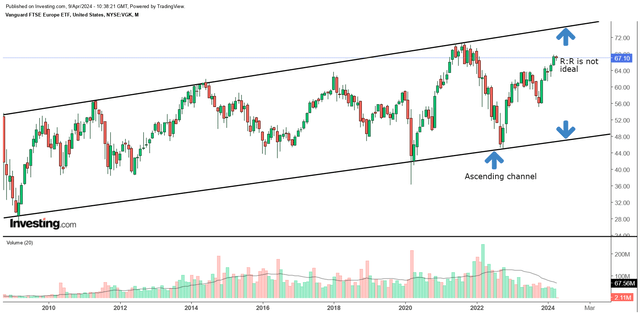
Finally, if we review VGK’s long-term price imprints since the GFC era, it’s pretty evident that this product has been moving up over time in the shape of an ascending channel. Timing your entries and exits within this channel has proven to be a rather rewarding strategy.
Now, if you look at where the price is currently perched ($67), and measure the respective distances between the upper and lower boundaries, we get a rather unappealing reward-to-risk equation of just 0.35x. In light of this, we don’t believe VGK would make a great buy here, and would prefer to see a pullback closer to the lower boundary of its channel, or when the reward-to-risk equation exceeds 1x.
Read the full article here


