The drop in new orders was off an all-time high, while unfilled orders rose to an all-time high. Orders by major category.
The headlines had a kind of shocking collapse-is-nigh quality: Manufacturing orders plunged “by the most since April 2020.” These are new orders that manufacturing sites in the US received. But the drop was off the all-time high a month earlier. And unfilled orders rose to an all-time high. The Census Bureau released the data on Monday. So here we go.
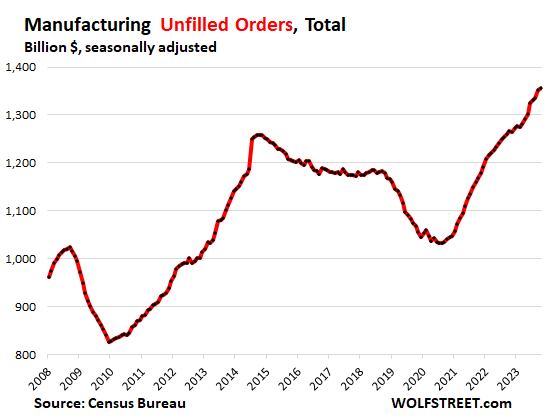
Unfilled orders rose to an all-time high of $1.36 trillion in October, up by 7.1% year-over-year, and up by 27% from 2019, according to Census Bureau data today. That’s the total backlog:
New orders fell 3.6% from their all-time high in September to $577 billion in October.
The data jumps up and down dramatically every month to the great excitement of the headlines. And the drop in October came off the all-time high in September. And it came after a huge spike in orders during the pandemic through June 2022. So compared to October 2019, new orders in October were still up by 26%!
The drop in new orders of $21.8 billion in October from the record in September was mostly caused by “nondefense aircraft and parts” – a very volatile category powered by huge but irregular orders for Boeing – which plunged by half, or by $15.9 billion. But some other industries saw record manufacturing orders.
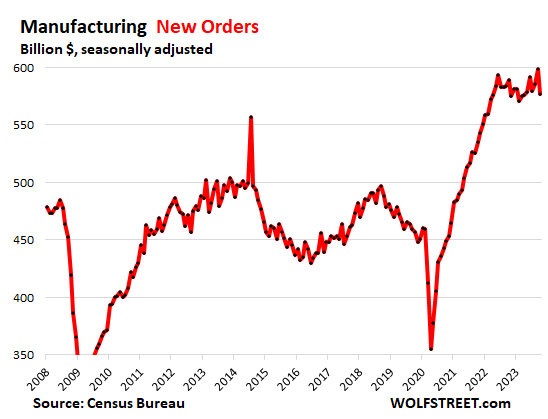
What we can see is that after the spectacular spike through mid-2022, the boom in new orders overall has been plateauing at around these record levels for months, reached a new record in September, and declined off the record in October, in data that is notoriously volatile, with big month-to-month ups and downs.
Major categories of new orders at US manufacturing sites.
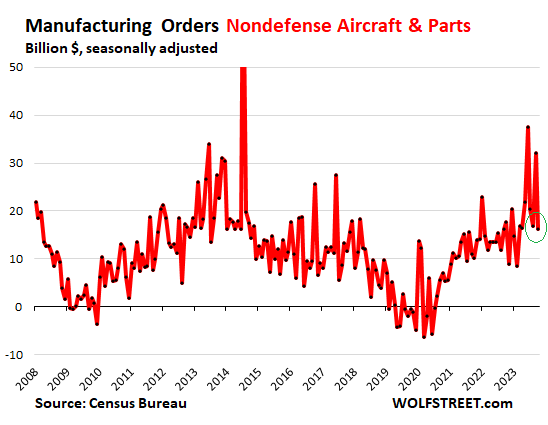
Orders for Nondefense Aircraft and Parts plunged by half and were the big culprit in the month-to-month decline. They are always volatile, spiking and plunging from month to month, as Boeing may get a large order in one month, and not much in the next.
In October, orders plunged to $16 billion from $32 billion in September, and were back roughly where’d they been in August.
See the negative orders starting in 2019? This occurred following the second crash of a Boeing 737 Max that triggered a wave of order cancellations, and previous orders were backed out.
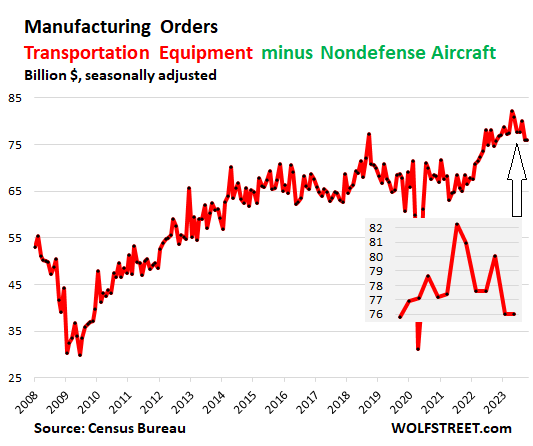
Transportation equipment was dragged down by the plunge in nondefense aircraft orders. In October, orders for transportation equipment dropped by $15.9 billion to $92 billion.
Without nondefense aircraft, orders for transportation equipment were unchanged in October from September, at $76 billion, were also roughly unchanged from a year ago, and were up 12% from 2019. This category too shows big month-to-month ups and downs:
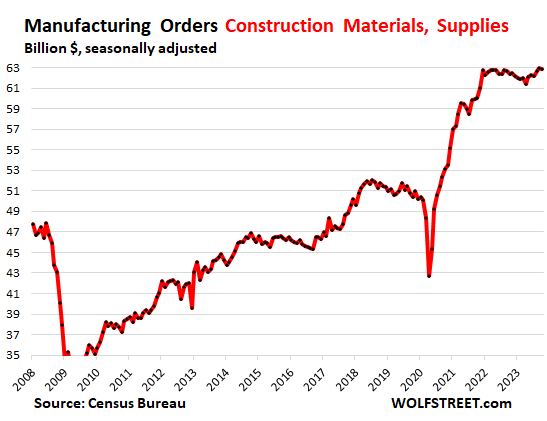
Orders for Construction Materials and Supplies reached a record in September and stayed there in October, of $63 billion, wobbling along a high plateau since early 2022. Orders were up by 24.8% from October 2019.
The spike in 2021 was in part driven by price increases, and in part by a surge in activity. But construction materials costs stopped rising last year and this year, and many materials have seen sharp price declines, including lumber.
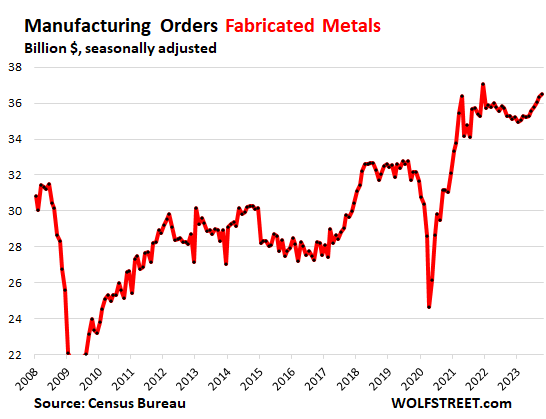
Orders for fabricated metals rose to $37 billion, the second highest ever, just behind the one-month wonder of December 2021. Up by 3.5% year-over-year and by 13.6% from 2019:
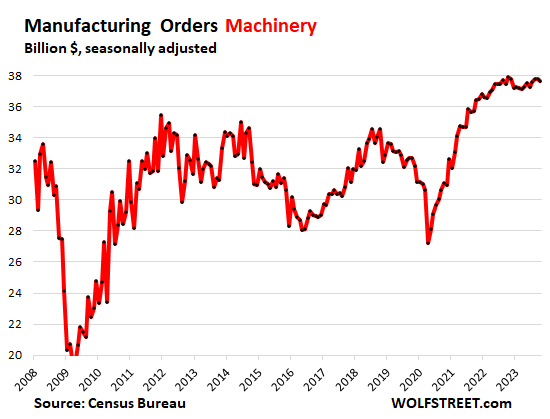
Orders for machinery – equipment for construction, agriculture, mining, oil & gas drilling, manufacturing, power generators, etc. – at $38 billion, were roughly unchanged for the month (-0.1%) and year-over-year, and up 15.1% from 2019:
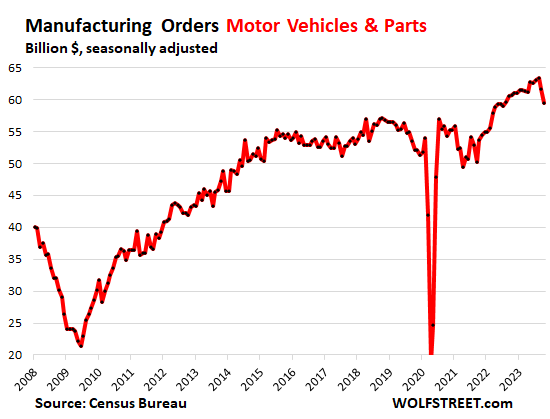
Orders for motor vehicles fell by 3.6% for the month, to $60 billion, the second months in a row of declines, off the all-time high in August.
Unit sales at dealers are up by the double digits from a year ago. During and after the shortages in 2021 and 2022, dealers have been trying get inventory, and now they have inventory, and they can back off some from their ordering-frenzy. In October, orders were still 14.3% higher than in 2019.
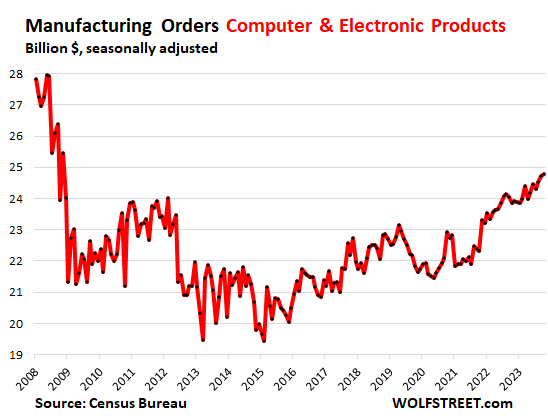
Orders for Computer and Electronic Products rose to the highest level in 15 years, up by 4.0% year-over-year, and up by 13.6% from 2019.
The industry is infamous for persistent price declines as the technology moves forward. Price declines are in the nature of tech products, and have been for decades, where ever increasing performance becomes available for less and less. Since this data is not adjusted for price changes, it reflects the price declines in addition to other dynamics:
Original Post
Editor’s Note: The summary bullets for this article were chosen by Seeking Alpha editors.
Read the full article here


