The VanEck Morningstar SMID Moat ETF (BATS:SMOT), which I started covering earlier this year, is all about moaty plays in the small- and mid-cap equity echelons. This is an alluring concept, marrying up the resilience inherent in moaty players with the valuation benefits investors typically anticipate from smaller companies. At first glance, this amalgamation is positioned for success. The issue here, as always in investing, is to not set expectations too high.
SMOT did have remarkable momentum initially, soaring immediately after its launch in October 2022, with steady gains lasting into February 2023, when its price return since inception surpassed 21%, a result neither the market represented by the iShares Core S&P 500 ETF (IVV) nor its larger peer VanEck Morningstar Wide Moat ETF (MOAT) could compete with, let alone the iShares Russell 2000 ETF (IWM).
Seeking Alpha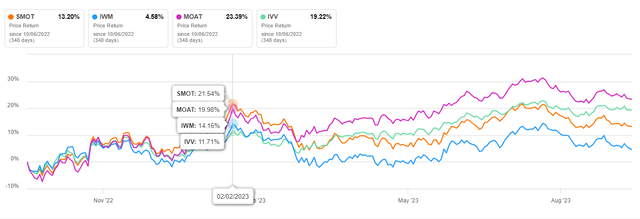
But as I warned in the February article, it was unwise to expect the fund to deliver such outsized returns consistently going forward. And since that note, SMOT has trailed the bellwether index by almost 12%.
Seeking Alpha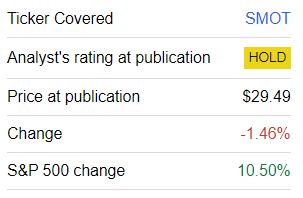
A bigger story behind this performance is that a great deal of earlier gains evaporated in February and the first two weeks of March, with the fund trading principally range-bound in the spring. The summer was a bit more ebullient, but as a more skeptical sentiment has been dominating on the Street since July, the fund’s attempt to entrench above the early February levels ended to no avail.
Also, since the May article, SMOT has failed to outmaneuver the S&P 500 index as well, trailing it by about 56 bps.
Seeking Alpha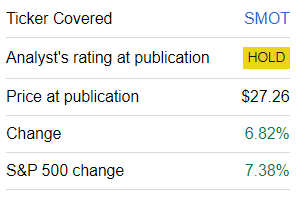
Today, I would like to provide a review of a fresh version of its portfolio, discuss the most relevant factors, and explain why there will be no rating upgrade.
Recapping Strategy Basics
As a refresher, SMOT has been tracking the Morningstar US Small-Mid Cap Moat Focus Index since its inception in October 2022. The fact sheet says the index:
… is intended to track the overall performance of small- and mid-cap companies with sustainable competitive advantages and attractive valuations according to Morningstar’s equity research team.
The bedrock of the index methodology is the concept of an economic moat. According to the summary prospectus, the Morningstar US Small-Mid Cap Index is the selection universe. Potential constituents must pass the moat (narrow and wide moat names can qualify), size, momentum, and liquidity tests; they must also have a fair value estimate from Morningstar’s Equity Research team. Importantly, as mentioned in the index overview, it has a staggered reconstitution. The SMOT summary prospectus has the following clarification:
The Index is divided into two equally-weighted sub-portfolios, and each is reconstituted and rebalanced semi-annually on alternating quarters.
Factor Story: How Exposures Fluctuate Over Time
Moat stocks have an alluring patina of stability, resilience, and seemingly steady future growth. However, it is much more important to look beyond the patina and pay attention to exactly what moat-centered portfolios contain and what they can offer in terms of factors. Another way of saying, successful investing is not about impressions; it is about facts.
Since the previous note, SMOT’s underlying index has seen two reconstitutions, namely in June and just recently in September. So it would be interesting to assess how factor exposures have been fluctuating.
In the current iteration, SMOT has a portfolio of 97 holdings (excluding cash), with the group of key ten sporting a 14.7% weight, while the ten smallest positions account for just 5.4%. Here, it is worth reiterating that investors who are searching for exposure to the small-size discount (i.e., to companies valued at less than $10 billion or ideally with much lower capitalizations and, hence, certain value credentials) would hardly be satisfied with what SMOT is offering at the moment. In fact, it has never been a small/mid-cap-heavy play, as I have highlighted this issue in the February article already; back then, the weighted-average market cap stood at around $17 billion. Now, as less than 40% of the holdings belong to the mid-cap echelon while small caps are completely absent, the market cap stands at about $15.9 billion, with the smallest company (as of September 19) being O-I Glass (OI) valued at $2.78 billion. Moreover, 16 holdings are valued at more than $30 billion, including NXP Semiconductors (NXPI), which has a market cap of $51.4 billion.
Next, let us provide a quick review of the holdings added and removed upon the most recent reconstitution. Comparing the tickers in the datasets (downloaded from the VanEck website) as of September 14 and September 18, I noticed that 17 companies were removed, namely Splunk (SPLK), Workday (WDAY), Blackbaud (BLKB), etc. 15 names were added, including NiSource (NI) and Kroger (KR); in total, they account for about 10% of the net assets.
So, the portfolio has been noticeably reshuffled, but factor exposures did not change much. The chart below compares the pivotal factor parameters of the May and two September versions of the portfolio:
Created using data from Seeking Alpha and the fund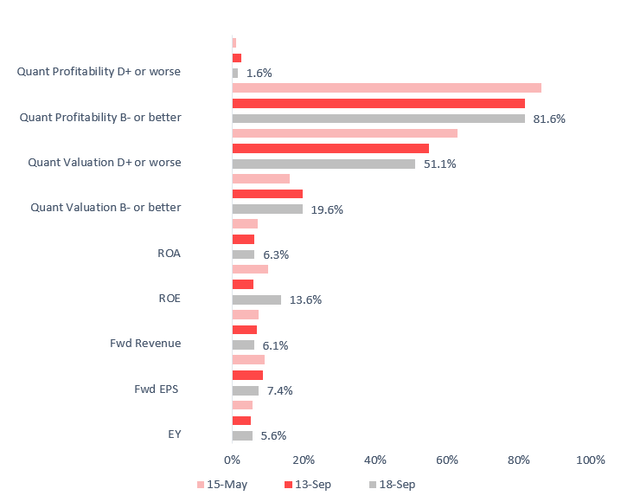
Overall, looking at the data above, I see no justification for a Buy thesis. More specifically, the earnings yield did improve marginally to approximately 5.6%, but the share of stocks with a D+ Quant Valuation rating or worse is still above 50%, even though there was a sizable improvement compared to the May version. There is a material quality premium reflected in these valuations, as almost 82% of the holdings have a B- or higher Profitability rating; however, for a large-cap-heavy basket, the result could be better. Return on Equity has improved notably, with the main reason being a lower share of unprofitable companies in the new version of the portfolio. Be that as it may, both ROE and ROA are rather mediocre. Finally, we see a smaller exposure to growth, with the current weighted-average forward EPS and revenue growth rates at their lowest levels compared to the previous versions of the portfolio.
Investor Takeaway
According to its website, SMOT represents “U.S. small- and mid-cap companies with long-term competitive advantages.” A nuance here is that even though it delivers on the quality front, the size question is much more complicated as there are no small caps in the portfolio, with most net assets allocated to large caps. For better context, its measly 65 bps overlap with IWM (as per my calculations) is rather telling.
The ETF is approaching its one-year milestone with mixed results. Unfortunately, initial momentum quickly evaporated, with the price peaking in February, and even though it retested this level in July, an attempt to break through it ended to no avail, with resurfaced concerns over inflation and interest rates dragging it down.
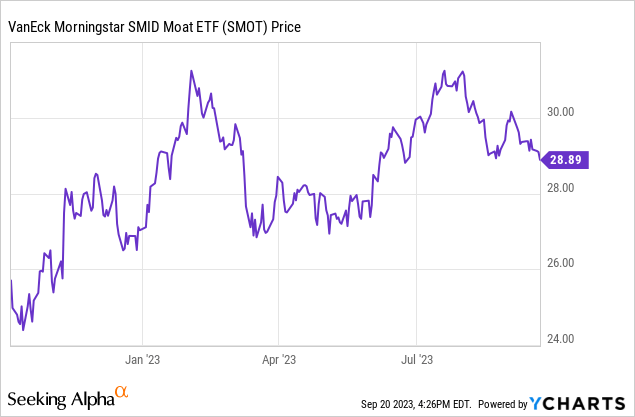
Furthermore, I am skeptical about SMOT once again retesting its 52-week high of $31.42 amid “higher rates for longer.” So, investors should not set expectations too high.
Also, in case dividend investors ask me about whether SMOT would be complementary in their yield- or growth-centered portfolios, I would answer that it is worth avoiding it. The weighted-average yield of the portfolio is diminutive at 1.55%, as 27 holdings (26.5% of the net assets) do not pay a dividend at all. For example, Adient plc (ADNT) suspended its quarterly dividend in 2018 and has not reinstated it since then. My calculations also show the WA 3-year dividend CAGR at 6.5% and the 5-year CAGR at 5.5%; these levels are hardly spectacular. So, I would not say SMOT deserves an upgrade.
Read the full article here


