

What Is A Moving Average?
Moving Averages are the easiest technical indicators to understand, notably the simple moving average (SMA). Calculating one involves pinpointing the average price over a specific number of recent trading days, such as 50 days or 100 days. If the calculated average is higher than the previous average, the moving average is said to be rising.
How Is A Golden Cross Identified?
A moving average cross occurs when a faster (shorter term) average crosses a slower one (longer term). It’s been evident to observers for decades that a faster moving average crossing above a slower one was a positive development
The classical Golden/Death Cross moving average lengths are the 50/200 day SMA combination. This combination is quite useful to keep track of broad indices for a few simple reasons, which is why such crosses are often briefly noted in the financial news. These short notices are always careful to characterize conventional technical interpretations of crosses as assertions.
The term Golden Cross applies when a given investment’s 50-day moving average crosses above the 200-day moving average
The term Death Cross is used to describe when an investment’s 50-day moving average crosses below (to the downside) the 200-day moving average.
Golden Cross Example
The below chart presents an actual golden cross that occurred for the S&P 500 on February 2, 2023. The 50-day moving average, represented by the blue line, crossed above the S&P 500’s 200-day moving average.
JIFriedman.com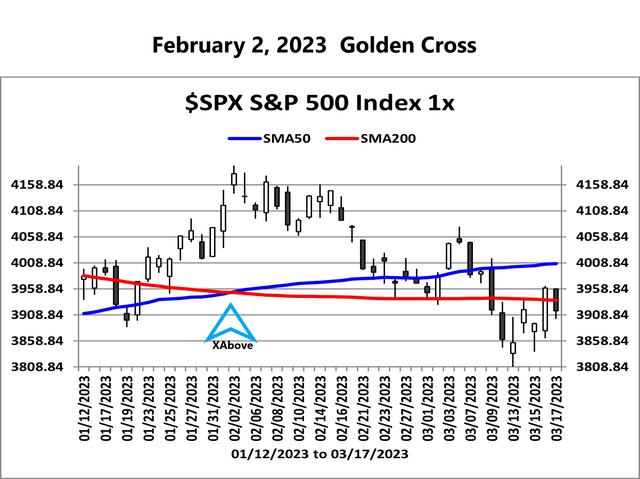
.
Stages Of The Golden Cross
Start To Maturity
JIFriedman.com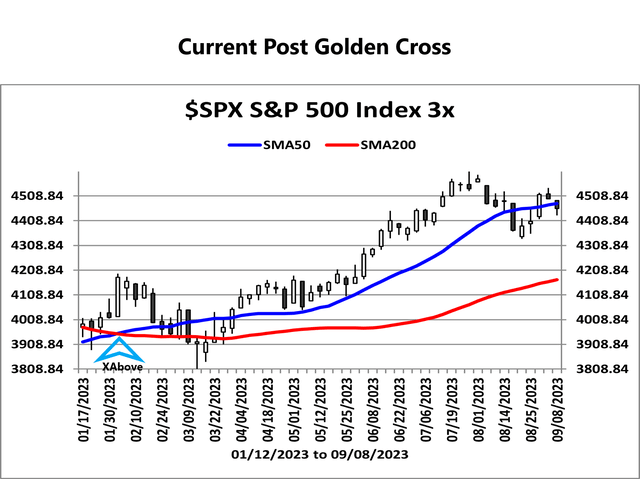
In the above chart, you can see a market price spike at the point marked by the light blue arrow. This spike drives the 50-day moving average above the 200-day moving average, achieving a Golden Cross.
In the early stages of a Golden Cross, it isn’t unusual to see the gap widening between the long and short-term averages.
However, investors should always be aware of the difference between price and these moving averages as it is a quick and useful way to visualize risk. A quick negative excursion to the 200-day SMA is always an unpleasant possibility that is worth planning for.
Maturity To Collapse
JIFriedman.com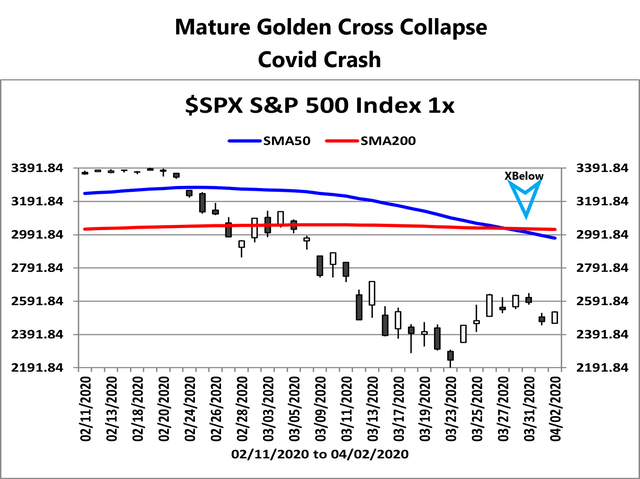
As the bullish trend accompanying a Golden Cross matures and weakens, the distance between the two moving averages can tighten quickly. The security price often drops sharply as volatility increases. The suddenly elevated volatility is visually striking compared to the tiny pre-crash candles at the top left.
Understanding The Golden Cross And Crossing Strategies
Mechanical buying of a golden cross leaves unanswered questions about when and where to sell. The simplest way many traders play these moves is to buy the golden cross with a crude strategy of holding until a subsequent death cross.
Moving average crossing strategies are thoroughly researched because a computer can quickly work its way through all reasonable short/long length combinations and a large universe of stocks with many years of time series price data.
A major selling point of the 50/200 day SMA combination is that, in a broad index, crosses are rare. That makes them useful for long-term trend identification and evaluation. A 50/200 combination, the Golden Cross, is quite unique and interesting in its return distribution.
Other Moving Average Combinations
Other moving average combinations beyond the classical 50/200 Golden Cross and Death Cross are frequently used by traders as well. One of the other more common daily SMA combinations is the 20 versus 50-day simple moving averages.
Golden Cross Advantages And Limitations
Advantages
- The data used to confirm a Golden Cross is objective.
- The positions of the 50 and 200-day simple moving averages of major indices are very useful to keep track of because they often do a good job of identifying major trend.
- In a mature bull market, the distance between price and the 200-day SMA is a good way to quickly quantify risk.
- The classical Golden Cross is widely understood and covered by financial commentators.
Disadvantages
- The assertion that a golden cross identifies a promising buy point does not necessarily stand up to scrutiny.
- A Golden Cross confirms an uptrend that is usually already quite obvious. A Death Cross often happens after the low has been made.
- The traditional interpretation of the Golden Cross mixes up cause and effect.
- Some skeptics believe that if a certain signal is too widely followed by market participants, it loses its value.
What Is Stock Chart Interpretation?
Interpretation of time series data is an innate human ability that determines how we deal with reality. Stock charts display time series data visually in ways that facilitate investment planning and decision-making.
A decent understanding of chart interpretation is important basic knowledge for any serious investor. The underlying visual nature of chart interpretation is easy to learn and understand.
Charles Dow (1851-1902) elucidated the basic principles of stock chart interpretation in a famous series of 255 editorials in the Wall Street Journal, which eventually became known as Dow Theory. This became the foundation for Technical Analysis:
financial analysis that uses patterns in market data to identify trends and make predictions. Oxford Languages Dictionary
Technical analysis has gone in many different directions over the subsequent 120+ years. None of the various techniques rises to the level of an academic discipline. This implies that even experienced and skilled practitioners can make devastating logical errors due to lack of understanding of various hard science subjects such as statistics, information theory, stochastic systems, etc.
In the 1980s, with the growing availability of computers, stock chart creation became semi-automated and indicators (visual aids) to facilitate chart interpretation were easy to develop. This led to attempts at developing computerized strategies. Strategy logic made it possible to assess common technical conditions and formations to determine if they evolve in consistent and predictable ways that an investor might use to maximize return.
The Bottom Line
A Golden Cross is a technical indicator that’s confirmed when a certain investment’s 50-day simple moving average crosses its 200-day simple moving average to the upside. The Golden Cross is conventionally seen as a bullish signal, while its cousin, the Death Cross, is widely interpreted as a bearish signal.
There are no guarantees that using a Golden Cross as a buy signal will deliver outsized profits. The simple assertion by many commentators to buy golden crosses and sell death crosses without comment or evidence may merit investor scrutiny.
Read the full article here