The name “Standard and Poor’s 500” is synonymous with large companies. The S&P 500 Index (SPX) and ETF (SPY) tracks the price-only performance of the top 500 US companies by market capitalization. Rightfully or wrongfully, the S&P 500 Index is the most popular market benchmark for retail investors and is the investment return standard most utilized for comparison. According to S&P (SPGI), SPX has historically been utilized as the best single valuation measurement of large-capitalization US equities and incorporates ~80% of available market capitalization. SPX and SPY are market-cap weighted indexes and ETFs. Other ETF sponsors, such as Vanguard, offer SPX-based investments, such as Vanguard S&P 500 ETF (VOO).
However, there are several other strategies incorporating the same 500 companies, including slimmed down versions of the largest 50 or 100 companies and equal-weighted portfolios. Since early 2009, I have been a supporter and owner of S&P 500 Equal Weight ETF (NYSEARCA:RSP) as both my market investment and as my personal investment benchmark.
Indices weighted by market caps are inherently momentum-based. Sectors currently in vogue will represent larger allocations. The table below from Bespoke Investment Group and Morningstar outlines the S&P 500 Index sector allocations in 1993 and currently, along with the sector investment characteristics and the change in portfolio allocation over the past 30 years.
S&P 500 Sector Allocation 1993 vs 2023 (Bespoke Investment Group, Morningstar, Guiding Mast Investments)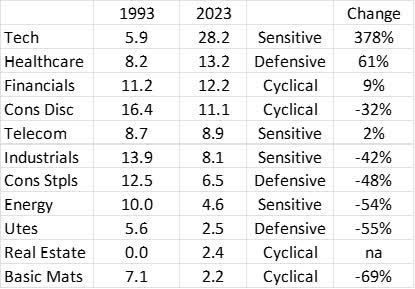
As shown, sector allocation in market-cap weightings has significantly shifted over the past three decades. Of most interest is the make-up of the allocation of the three major investment categories – Sensitive, Cyclical, and Defensive. Over the past 30 years, economically sensitive stock exposure has increased by 29% while cyclical exposure has declined by -20% and defensive exposure has declined by -16%.
With the recent reshuffling of sector components, the impact of the “technology” sector is understated in the above 2023 comparisons. I recently offered this review in the Sept 2023 issue of Guiding Mast Investments,
One of the most intriguing market factoids concerns sector concentration, specifically technology. At the height of the dot-com bubble, tech sector allocation of the S&P 500 went above 34%. Currently, it’s at 28%. But if you add firms like Amazon (AMZN), Tesla (TSLA), and Netflix (NFLX) – which could arguably be considered tech companies – and Alphabet (GOOG, GOOGL), Meta (META), Visa (V), Mastercard (MA), PayPal (PYPL), and Fiserv (FI) – which were once considered to be in the tech sector but have been moved to bolster the performance of other sectors – “technology” allocation balloons above 41%.
As shown, market-weighted SPY has an issue with sector diversification and concentration. Over time, the market-weighted SPX index has become more economically sensitive and less defensive.
Enter equal weighting of the same companies in the SPX index. Equal-weighted indices offer the same portfolio of stocks but in a different allocation. Rather than allocating based on market capitalization where the largest capitalization companies represent the largest portfolio positions, equal weighted owns the same allocation of each stock. This strategy invests equally in all 500 companies of the S&P and rebalances periodically, selling the overperformers and buying the underperformers.
The concept is not new and equal weighting of the SPX has been around since Dec 1985 with the first introduction of the strategy by the now-defunct Dean Witter Value-Added Market Series mutual fund. The fund greatly disappointed investors principally from excessively high mutual fund expenses (1.8% annually) and unfortunate timing, becoming known around Morningstar’s offices as the “Dean Witter Value Subtracted Fund”. By 1997 when the fund was closed, DW Value Added fund had underperformed by 26% vs the market-cap weighted index, resulting in the strategy being abandoned by most advisers. On April 30, 2003, the Invesco S&P 500 Equal Weight ETF (RSP) was introduced.
The simple change from market cap to equal weighting creates tremendous differences in the portfolio and its performance over time. One of the most telling differences between market and equal weighting of SPX is equal weightings tilt towards value vs growth and mid-cap vs large cap. M* offers the following “investment style boxes” for RSP and SPY:
RSP Style Box
RSP Investment Style (morningstar.com)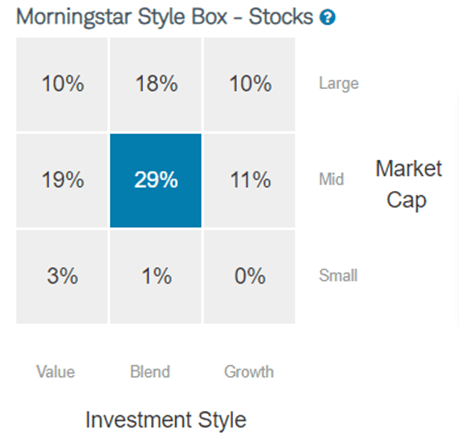
SPY Style Box
SPY Investment Style (morningstar.com)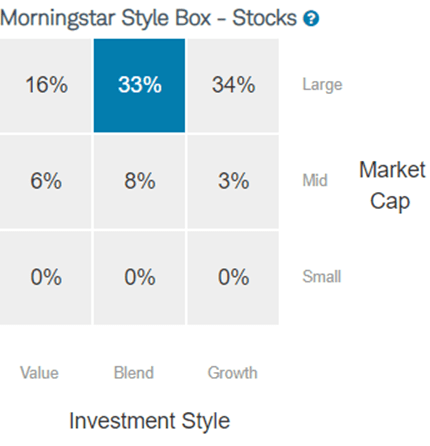
From a portfolio analysis viewpoint, Morningstar offers an interesting side-by-side comparison of the characteristics of each index. As shown below, RSP has sizeable exposure to mid-caps and value stocks vs SPY’s offers sizeable exposure to large-caps and growth stocks.
Portfolio Analysis RSP vs SPY (morningstar.com, Guiding Mast Investments)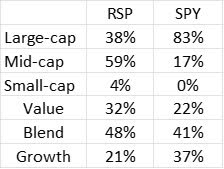
Concerning performance comparisons, it is a bit of picking your dates to match the outcome you want. The chart below from dividendchannel.com reflects total returns of RSP vs SPY since its inception on April 30, 2003, with dividend reinvested.
Performance RSP vs SPY Dividends Reinvested 2003 – 2023 (dividendchannel.com)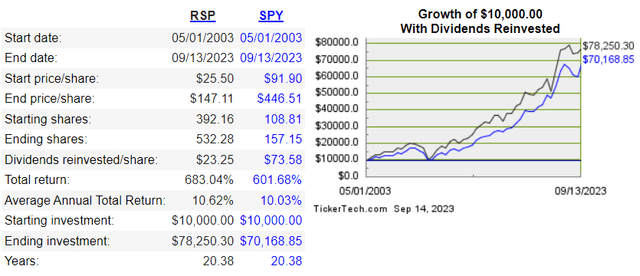
Some may say times are different with technology more important today than in 2003, or investors can’t compare current market conditions with even 10 years ago. Others may point out RSP has declined more in market corrections, offsetting its bull market outperformance. A few investors may feel that the difference of a measly 0.59% annual average total return is hardly worth the effort of changing from SPY to RSP.
I take the opinion that RSP is a better proxy for the markets and my own portfolio. I certainly don’t have 41% of my portfolio invested in “technology-like” stocks similar to the current market-weighted SPY. RSP has been used as the preferred market benchmark by Guiding Mast Investments for over 10 years, and I tend to favor equal weighting in several of my sector funds as well.
From a recommendation vantage point, I think the overall market offers more downside risk than the opportunity to profitably satisfy the FOMO crowd. While I am reluctant to buy RSP at current levels for investors with shorter-term horizons, RSP has performed admirably for me since 2009 and I would not hesitate recommending RSP to all long-term investors looking for a broad-based S&P 500 ETF.
Read the full article here


